We used 2039 samples from rural areas of the British Isles, from people whose four grandparents were all born within 80km (50 miles) of each other. After over a decade of sample collection and data analysis, the findings of the study were published in Nature on the 19th of March 2015.
We were absolutely astonished to obtain 17 clusters of individuals based solely on similarities in their DNA that matched remarkably well their geographical locations.
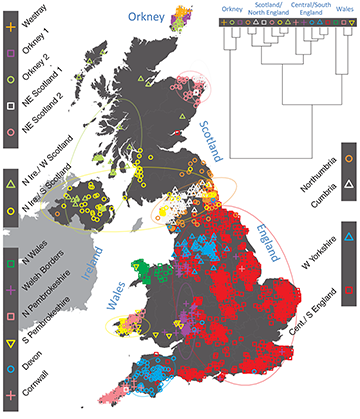
The map shown in Figure 1 is a plot of all the individuals at the average position of their grandparents’ place of birth, where different groups are represented by the combination of the type of symbol and its colour.
The most striking observation is the extraordinary correspondence between the genetic clusters and geographical location.

Figure 1.
By successively merging the most similar clusters a hierarchical cluster tree was obtained as shown in the upper right hand part of Figure 1.
Here, the groups that are most similar have the shortest branches between them, as for example the three clusters in Orkney (purple squares, green circles and orange crosses), and the two in South Wales (pink squares and inverted yellow triangles).
Interestingly, based on this hierarchical clustering, north and south Wales are about as distinct genetically from each other as are central and southern England from northern England and Scotland, and the genetic differences between Cornwall and Devon are comparable to or greater than those between northern English and Scottish samples.
The most different of all the clusters from the rest of the UK are those found in Orkney, what clearly corresponds to the existence of a Norse Viking Earldom in Orkney from 875 to 1472.
The next level of separation shows that Wales forms a distinct genetic group, followed by a further division between north and south Wales. This division corresponds well with the ancient kingdoms of Gwynedd (independent from the end of the Roman period to the 13th century) in the north and Dyfed in the south.
Subsequently, the north of England, Scotland, and Northern Ireland collectively separate from southern England. Then, at the next level, Cornwall forms a separate cluster quite distinct from Devon, followed by Scotland and Northern Ireland separating from northern England.
The split in the Northern Ireland group, one with the Scottish highlands and the other with the lowlands, suggests association with the people of Dalriada and with the Picts, respectively, a separation of clans that existed around 600 AD. The split in south Wales (pink squares and yellow inverted triangles) is suggestive of “Little England beyond Wales”.
Particularly striking is the distribution of the large cluster of people (red squares) that covers most of eastern, central and southern England and extends up the east coast. This cluster contains almost half the individuals analysed (1006).