Face genetics
Face to face is how we mostly recognise and communicate with each other. The recognition of individual faces is only possible because the human face is so hugely variable. The extreme facial likeness of identical twins, who inherit the same versions of each gene from each of their parents, and so have identical genotypes, shows that the various facial features by which we recognise people are inherited. This means that they are mostly determined by the particular combinations of genetic variants inherited from their parents. By genetic variant we mean a version of a particular gene that differs from other versions of the same gene at a given position in the DNA. The fact that the facial features of identical twins raised apart are as similar to each other as those raised together strongly supports the view that environmental effects on facial features are normally very limited.
Facial features, such as the shape of the nose, a receding chin or the ‘Hapsburg lip’, are often passed on in families from generation to generation. Our aim has been to identify specific genetic variants that determine particular facial features. Our success in being able to do this, which has not been done before, has depended on using complicated statistical procedures to analyse facial images of human volunteers.
Our starting point was a large collection of 3 dimensional facial images taken with a high technology commercial camera. These images provided us, after some manipulation, with a definition of each face as 30,000 points on the surface of the face, effectively a 3-dimensional map of the face. To compare features on different faces we overlaid all the face images in relation to each other. This is done by first overlaying the images with respect to a number of landmark points, such as at the tip of the nose or in the corners of the eyes or mouth. This procedure is rather like that used by Francis Galton, a pioneer of studies of faces and of twins, nearly 150 years ago, but now we have sophisticated computer tools and high technology cameras that improve enormously the extent to which we can overlay all the images with each other.
We have used volunteers from three sources: a) 1832 unique volunteers from our very well characterised People of the British Isles (PoBI) study, b) 1567 unique twins from the TwinsUK cohort, about equal numbers of identical and non-identical twins, and c) 33 images of East Asians, mainly Chinese.
Having the facial images of the twins enabled our next important step in the analysis, namely to identify the facial features that are likely to have high heritability. Two individuals who are identical twins have the same set of genetic variants (DNA sequences). It is those variants that determine their facial features and result in very similar faces. Facial features are defined by associated groups of points on the face, rather like the hills and valleys on a
3-dimensional map.
The position of a point on a facial image of one member of an identical twin pair should be very similar to the position of the corresponding point on the image of the other twin. The extent to which it is different will be a measure of the non-genetic environmental influences on the position of this point on the face. In contrast, two individuals who are non-identical twins may have different genetic variants determining at least some of their facial features. The position of the same point on a facial image of one of the individual non-identical twins will therefore tend not to be as close to the position of the corresponding point on an image of the other twin than if they were identical twins. The extent to which the points are further apart for the non-identical twins than for the identical twins is a measure of the genetic influences on this point, which geneticists call the heritability. Using further complex statistical procedures, we can weight each point on the face by its heritability measured in this way.
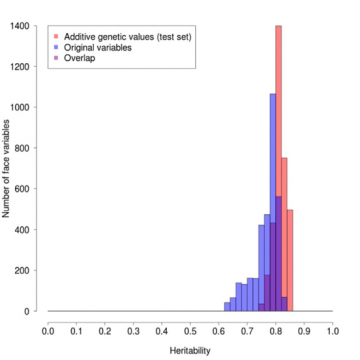
The effect of this weighting can be seen in Figure 1, in which we have plotted the frequencies of points on the facial profile that have different heritabilities. The degree of heritability for any given position ranges from 1 if the measurement is always exactly the same in pairs of identical twins but different in
non-identical twins, to 0 if the differences between identical twins are the same as those between non-identical twins, and so are effectively all
non-genetic, primarily environmentally determined. The red columns are for the weighted values, the blue for the original values and purple for the overlap. The red profile is clearly on average higher and much narrower than the blue, showing the beneficial effect of the weighting.

Figure 1: Comparison of profile heritabilities for original versus heritability weighted values.
The next challenge is to define the facial features to be used for the genetic analysis, based on groups of associated points. For this we use the heritability weighted points on the assumption that this will give a feature that is overall likely to be more heritable than that obtained using the unweighted points. The weighted points were used for what statisticians call a PCA, standing for Principal Components Analysis. This is a way of pulling out of the data the features that are most variable. Each PCA, and there can be up to 50 or more for complex data such as the facial images, is in itself a measure of a facial feature, analogous to the distance between the eyes, but that effectively combines various measurements based on a group of points into a single value.
So far, in defining facial features we have made no use of specific genetic information. We have DNA based genetic information on about 500,000 variants for each of about 1500 individuals from our PoBI volunteers for whom we have images and for a similar number of the TwinsUK volunteers with images. The next step was therefore to look for specific genetic variants that associated significantly with our PCA based facial features.
Our approach to the genetic analysis is based on the idea that differences in facial features should be analysed as discrete, individually identifiable characteristics, not as a quantitative measure, such as a person’s height. We cannot recognize a person just by their height or by any single quantitative facial feature, such as the distance between the eyes or the height to width ratio of the face. We deal with this by focusing on those individuals who are in the extreme upper or lower 10% of each of the values given by the PCA and asking whether they share any one or more of the 500,000 genetic markers more than those individuals not in these extremes. We used the People of the British Isles volunteers to pick candidate gene variants, out of the 500,000 tested, for further analysis based on the significance of the difference between the extremes and the non-extremes and on the magnitude of this difference. We then asked whether any of these candidate effects were replicated in the approximately 1500 TwinsUK volunteers. In this way, we have identified three specific and replicated genetic variants with relatively large effects, two for features of facial profiles and one for the region around the eyes. Each of these three variants has
a partner with a different DNA sequence at the same critical position, and in each case the positively associated variant has a PoBI population frequency of about 10%, with the partner having the higher frequency of about 90%. We call the associated variant a and its partner A, and so, as genes come in pairs, there are three combinations of these variants, aa, Aa and AA.
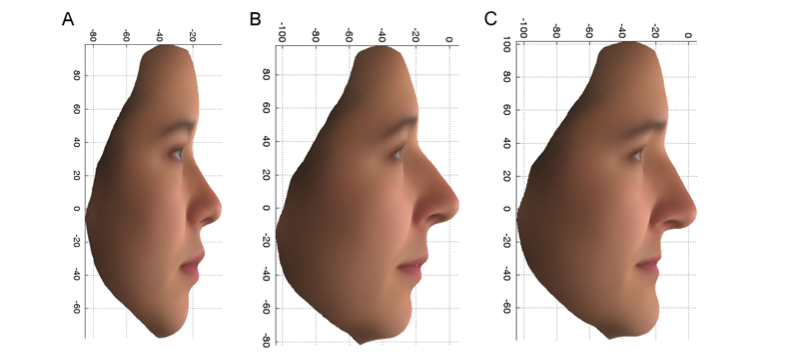
The first of these variants, found in a gene called PCDH15, increased the chance of having the female features shown in Figure 2C by a factor of more than 7 in those UK females who carried both copies of the variant (aa), compared to those that only had one (Aa) or no copies (AA) of the variant. This variant is also associated with features that differ between the UK and the East Asian female volunteers. Note the upturned end of the nose and upper lip and receded chin in Figure 2A, which is the average of the Chinese faces, and in Figure 2B, the more Chinese group of the PoBI individuals, and contrast this with Figure 2C. The product of the PCDH15 gene is found in the olfactory cells and cartilage of the nose of developing mice, which is consistent with
a possible effect on the nose of the variant we have found in humans.
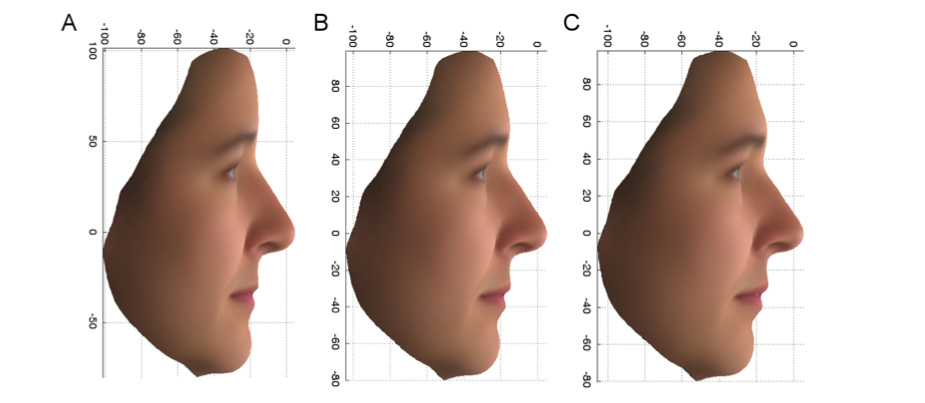
The second variant, in the gene called MBTPS1, is associated with the face difference shown in Figure 3. This difference was observed in females, and the distinctive subset of faces carried both copies of the variant (aa). In this case, the genetic variant associated with the upper extreme phenotype (Figure 3A), is present (presumably as aa) in the African Green Monkey, Macaque and Olive Baboon, while its partner, the common variant, is present (presumably as AA) in the Orangutan, Gorilla, Chimpanzee and Marmoset, suggesting that this variant difference may be associated with the face differences between these primate groups.
The third variant, in the gene called TMEM163, is associated in both sexes with a difference in the eyes, as shown in Figure 4. A defective version of this gene has a potential role in a disease called mucolipidosis type IV, a condition occasionally accompanied by facial abnormalities, particularly around the eyelids. In our studies, it is the subset of individuals carrying both copies of the variant (aa) that is associated with the upper extreme, shown in Figure 4A. Note that the eye width and eye height (from the bottom of the eyebrow to the top of the eye lid) are both greater in the upper extreme than in the lower extreme.

Figure 2: PC2 profile: Average faces, using the original variables, for 14 East Asian females (A) and the upper 10% (more East Asian) (B) and lower 10% (more European) (C) extremes of the PoBI females.
Each of the three genetic variants that we have been able to associate with a specific facial feature increases the chance of having the specific feature by
a factor of more than 7 in those UK volunteers who carry both copies (aa) of the variant, compared to those that only have one (Aa) or no (AA) copies of the variant.

Figure 3: PC7 profile: Average profiles of female faces, using the original variables, for the upper variant associated 10% (A) and lower 10% (C) extremes and the overall average (B).

Figure 4: PC1 eyes: Average eye phenotypes, using the original variables, for the upper 10% (A), the lower 10% (C) extremes, and the overall average (B).
Our success in finding these genetic variants depends largely on our ability to identify facial features that have a high heritability based on the twin data, and on the choice of extremes for studying the genetic variant associations. It seems likely that many more specific and relatively large genetic variant effects on human facial features will be found in the future using approaches such as we have described. This paves the way toward unravelling the molecular mechanisms by which genetic variants determine the extraordinary variability in human facial appearance.


